"In this activity, we use ratio and proportion to find the numerical values of a digitally scanned hand-drawn plot. For now, you will need the following software, Paint for finding the pixel locations on the graph, and Excel of Open Office Spreadsheet to tabulate the values of the graph."
What I did.
1. Photocopied a plot from the College of Science Libray from the following journal.
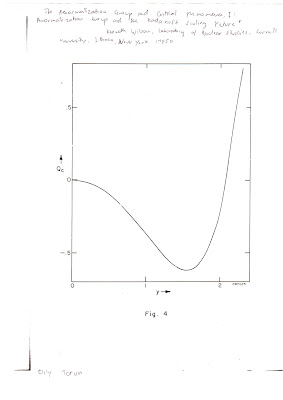
The Renormalization Group and Cricitical Phenomena I: Renormalization Group and the Kardanoff Scaling Picture by Kenneth Wilson from the Laboratory of Nuclear Studies, Cornell University, Ithaca New York, 14850 on 1974.
The photocopied image was then digitally scanned. (see picture below)
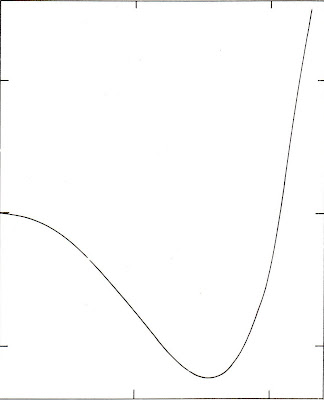
 For convenience, I cropped the image at the origin resulting to the image below.
The cropped image was then opened in MS Paint.
 Producing the Plot in Open Office:
Using MS Paint, the pixel location of the origin was recorded. Note that in paint, the (0,0) mark is at the top-left of the document. In this activity, the pixel location of the origin of the cropped image is at (220,1053).
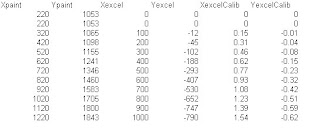
Using Open Office, I successively obtained the pixel locations of the graph at 50 pixel interval in the x-axis amounting to 33 data points. Using the pixel locations of the origin, I calibrated the pixel location obtained previously by noting that the top-left part of Paint is the (0,0) mark using the following formula:
Xexcel=Xpixel-220,
Yexcel=1053-Ypixel (see picture below for sample data points)

Next, I obtained the number of pixels/unit in the graph and obtained the following:
Pixels/unit in the x-axis = 648
Pixels/unit in the y-axis = 1276
Using this calibration I divided all the values of the Xexcel by 648 and all values of Yexcel by 1276. This will give the calibrated values of the graph in physical units.
In order to check if the reconstructed image and the original image are perfectly matched, the two images were overlayed. This can be easily done in open office by importing the scanned image as graphic. (Format->graphic->bitmap->import the image). After importing the image, click on the reconstructed graph and set the Area to the imported image (click on the graph->object properties->area->select bitmap->select your imported image).
At first, the images will not be perfectly matched. In order to overlay it perfectly, you must obtain the maximum locations of the grid in the x and y axis. Use this and modify the axes of the graph and set it to the obtained maximum.
The image below is the reconstructed image overlayed with the scanned image.
 Observe that the image grids in the scanned image and the reconstructed image are perfectly matched. Furthermore, the graph is well-matched with no visible offset. For this activity, I give myself a grade of 10 for perfectly reconstructing the scanned image.
very good blog, man!!!
ReplyDeletesecond :( !!!!
ReplyDeletePerfect fit!
ReplyDelete